Know Your Coastline
See exactly how your coast is changing and what actually works to protect it
Real Impact For Your Local Community
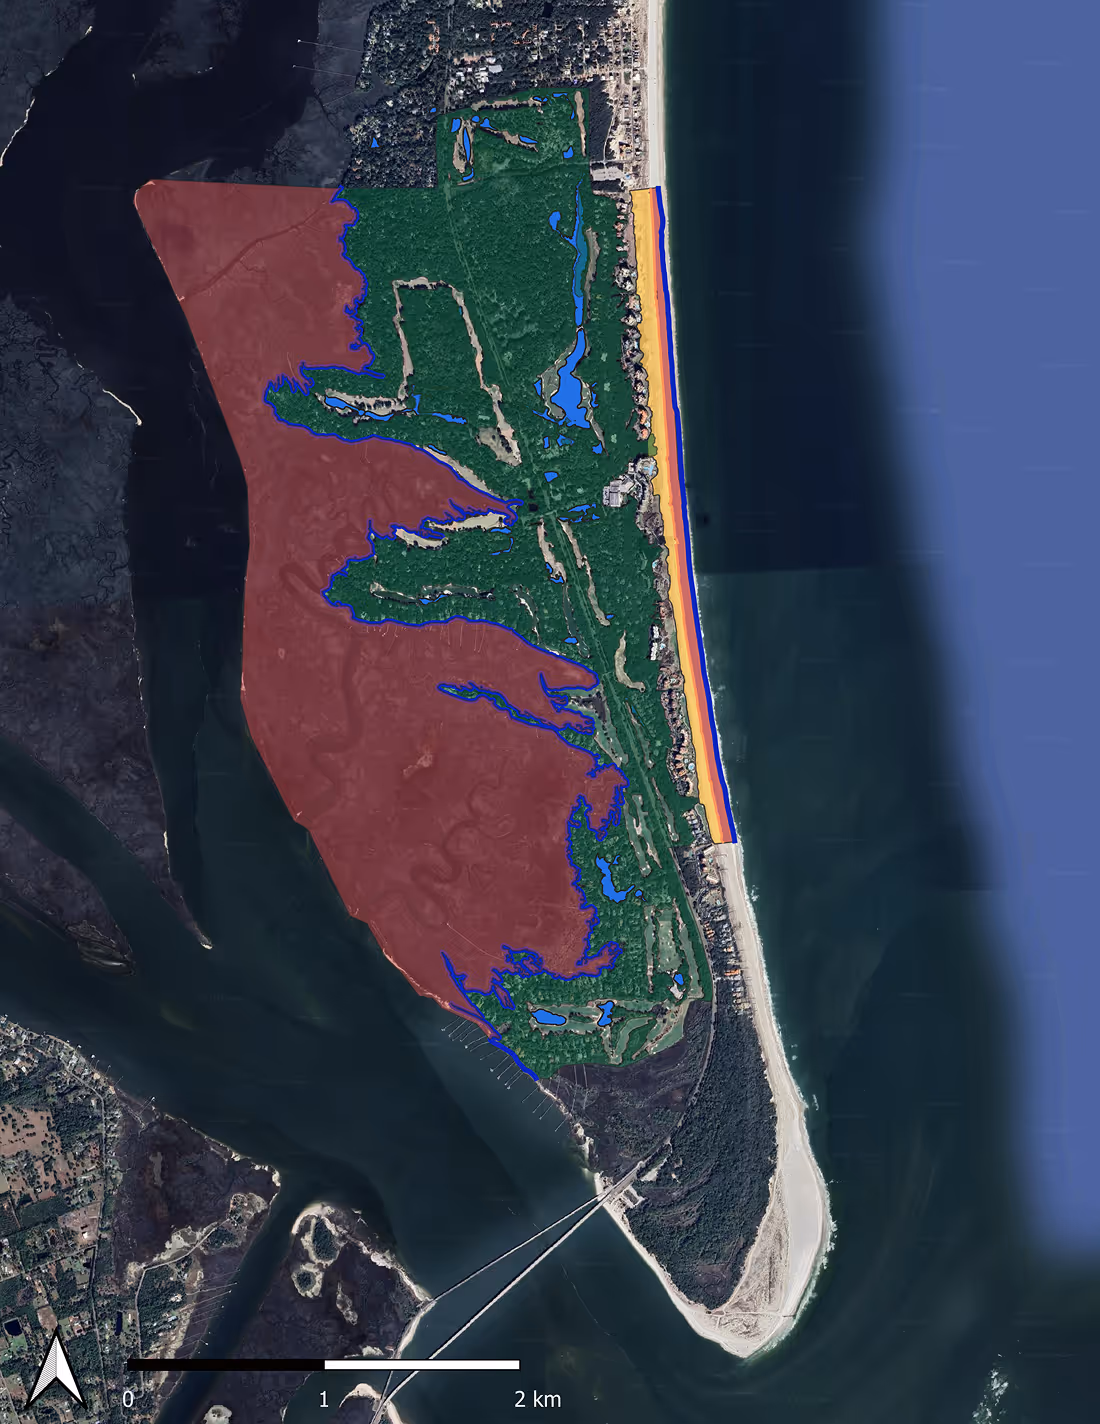
RCOAST delivers 4D coastal intelligence that shows your coastal health in easily understood formats so you can optimize your coastal interventions.
%201.avif)
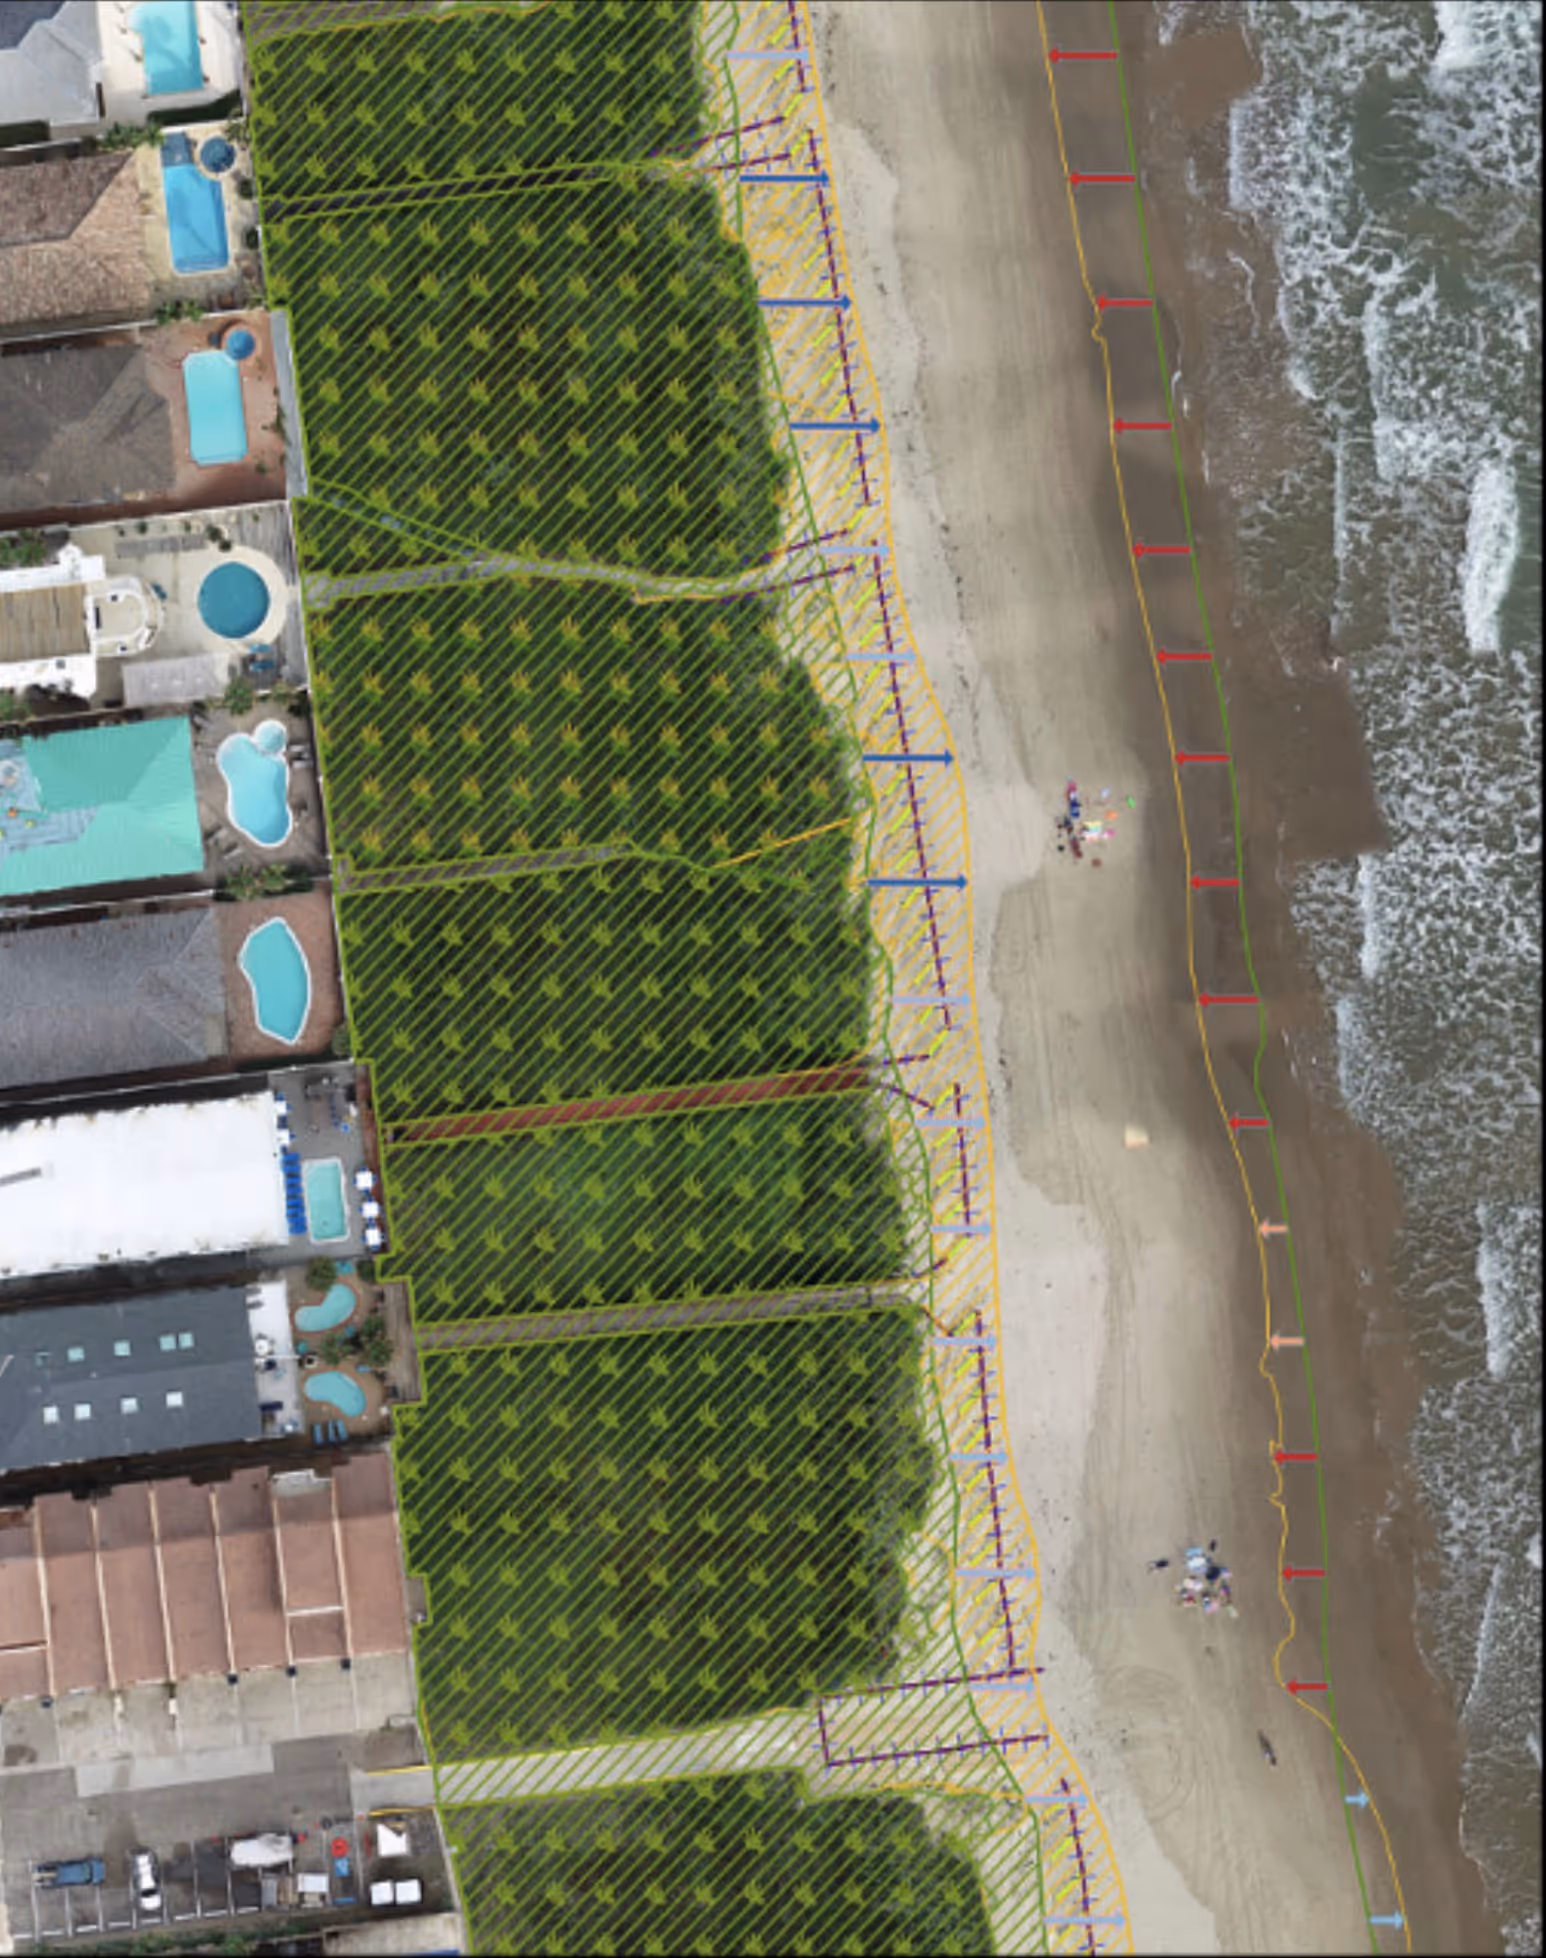
1. We Capture Your Coastline In Detail
Drones and aircraft equipped with LiDAR and multispectral imaging survey your shoreline with precision.
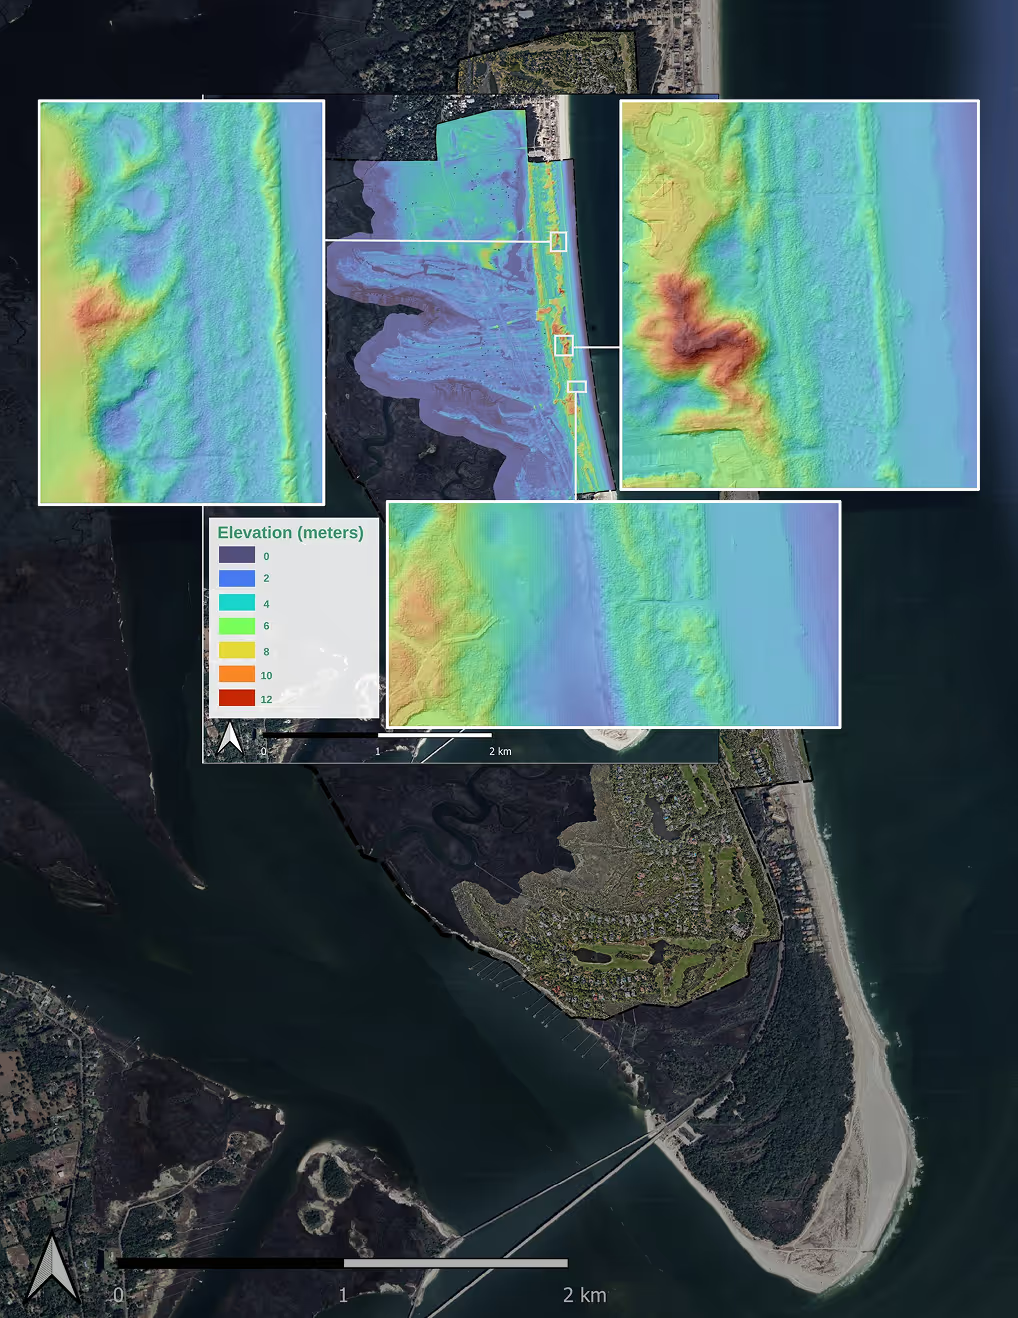
2. We Deliver Your Dashboard
Machine learning algorithms transform millions of data points into maps, performance scores, and predictions appear in a platform built for coastal managers that anyone can use.
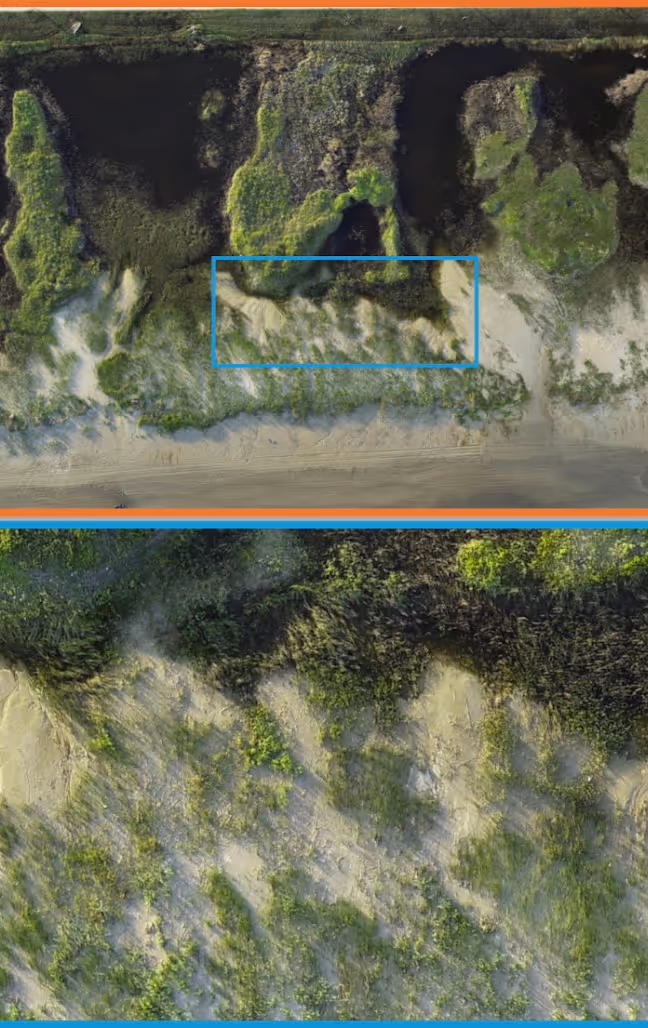
3. Ongoing Monitoring To Map Your Change
Ongoing monitoring so you can see what's working and track change over time. See how your mitigation solutions are working in real time.
Learn how RCOAST can help your community
Fill out the form and we'll be in touch soon!
Questions
Find answers about getting started with RCOAST for your community.
We use LiDAR and multispectral imaging from drones and aircraft to capture high-resolution coastal information. Machine learning processes this data into maps and performance scores. The result is precise, actionable intelligence about your shoreline.
Your community's data belongs to you. We maintain strict security protocols and only share insights you authorize. Privacy is built into everything we do.
Yes. RCOAST connects communities globally so you see what works in similar environments. Learn from Louisiana's living shorelines or Vietnam's mangrove restoration. Real solutions from real places.
Minimal. You need internet access and a web browser to view your dashboard. We handle the complex data processing on our end. It's that simple.
We collect data on a schedule that matches your needs. Some communities monitor quarterly, others annually. You decide the frequency that makes sense for your coast.
It measures how well your interventions are working. Whether it's a seawall or native vegetation, you see the actual performance. No guessing. Just data.
Absolutely. RCOAST data strengthens funding proposals with concrete evidence. Funders see exactly what you're protecting and how your solutions perform.
Costs vary based on your coastal area and monitoring frequency. We work with communities to find sustainable pricing. Contact us for a custom quote.
You do. Your team gets full access to the dashboard and all your data. We provide training and support, but you're in control.
Your first baseline data arrives within weeks. From there, you track changes over time. Real insights emerge as you monitor multiple seasons.
Still have questions?
Reach out to our team for detailed information.
.avif)
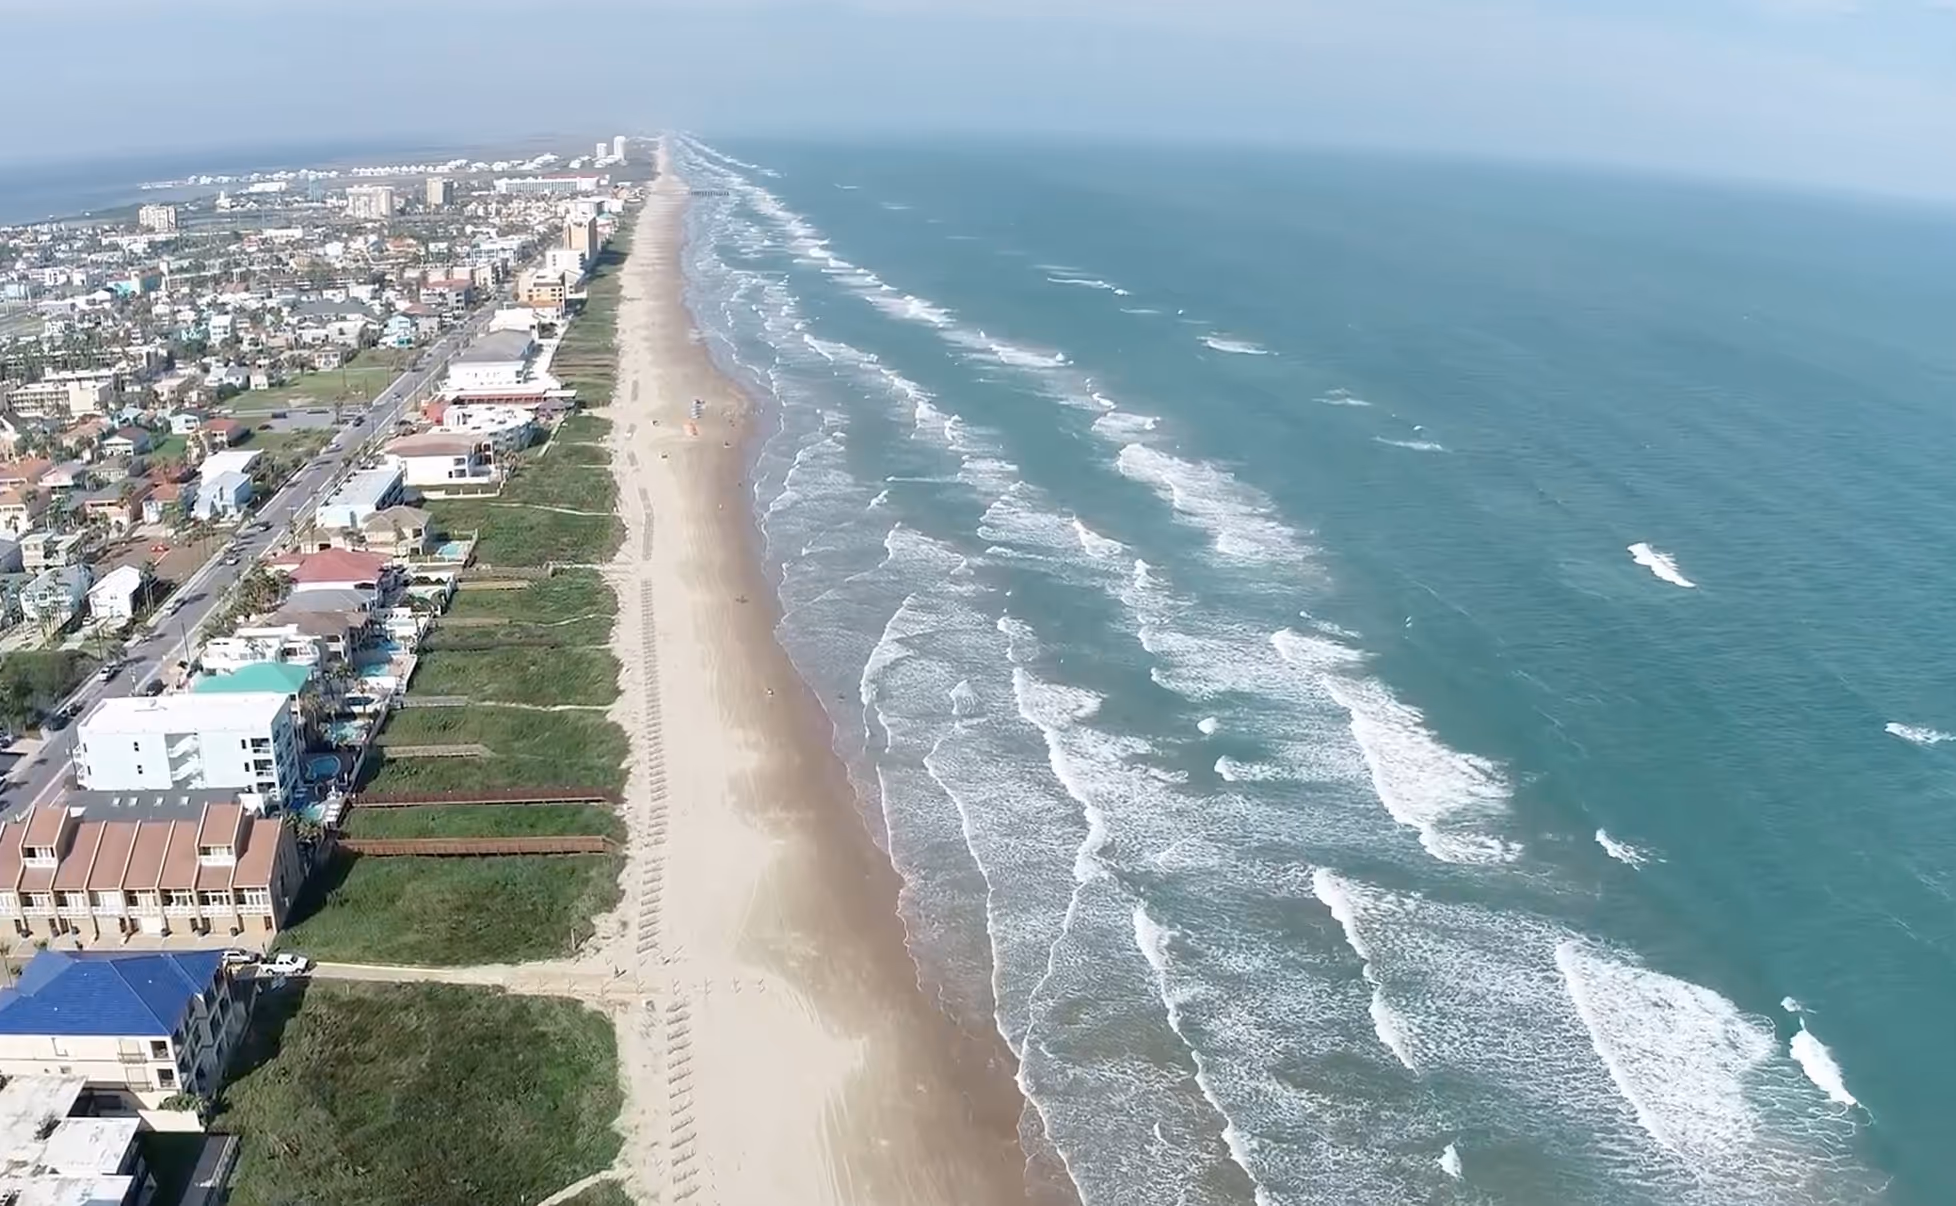
See How RCOAST Helps Communities
Aerial platforms capture real-time coastal conditions across documented projects, artificial intelligence analyzes data from specific scenarios, and you gain the knowledge to respond to similar situations.